
Amie Campbell
How can you tell if you’re infected with a disease? Maybe you have symptoms, or maybe you have been exposed to someone else you know has it. Either way, to be sure you would want to take a test that tells you with certainty whether or not you’re infected.
Perhaps unsurprisingly, testing is quite a hot topic at the moment. It is clearly important that we are able to test lots of people for coronavirus and that those test results are reliable. Maybe you have noticed that a lot of the focus is on the ‘accuracy’ of the tests, but it’s not quite as simple as it sounds…
Let’s suppose we have a test that gives a positive result to anyone who (based on the test) has the disease, and a negative test result for anyone who doesn’t.
If this were a perfect test, what would the results look like? Well, surely everyone who has the disease would receive a positive test result and everyone who doesn’t have the disease would get a negative result. We call a positive test result when someone does have the disease a true positive (TP) result. And a negative test result when that person doesn’t have the disease is called a true negative (TN) result.
However, this perfect-sounding test is too good to be true. In reality, some people without the disease will end up getting a positive test result, falsely suggesting that they are infected. We call this a false positive (FP). There will also be some people with the disease who will receive a negative test result, suggesting they do not have the disease when in fact they do. This is called a false negative (FN).
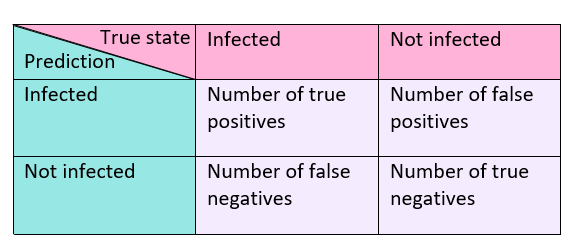
In summary:
| True positive (TP) | Have the disease, positive result |
| True negative (TN) | Don’t have the disease, negative result |
| False positive (FP) | Don’t have the disease, positive result |
| False negative (FN) | Have the disease, negative result |
False positives are definitely a big problem. A different disease with similar symptoms might be overlooked. Also, thinking you are now immune, you will act as though you are invincible to the disease, when really you are far from it!
False negatives will also cause large issues. Not only will your disease go untreated, but, without realising it, you will become a super-spreader, going about your daily life as normal, blissfully unaware that you are infecting everyone around you.
Now fortunately there are a few things we can do here. Depending on the nature of the disease, we may want to choose a test that gives fewer false positives at the expense of more false negatives, or vice versa.
Let’s consider a really deadly disease, such as the entirely fictional ‘dessert disease’ which causes you to turn into a cake within 3 days if left untreated. In this situation, you want more false positives rather than false negatives, so that as many of those infected with ‘dessert disease’ as possible can receive treatment to prevent them from turning into a Victoria sponge.
Imagine there was another, far less deadly but still completely made up disease called ‘pudding pox’ where, upon catching it, you become an apple pie for 3 hours, but afterwards go back to normal. The symptoms of ‘pudding pox’ and ‘dessert disease’ are the same. You would want a test for ‘pudding pox’ to have a very small number of false positives, as you wouldn’t want the more deadly ‘dessert disease’ to be mistaken for ‘pudding pox’ and go untreated. Of course for most diseases it will not be this clear cut, but hopefully this gives you the idea (and also didn’t make you crave cake too badly…).
We can represent the number of each type of result – true positives, false positives, true negatives and false negatives – in a grid, which is called a confusion matrix.
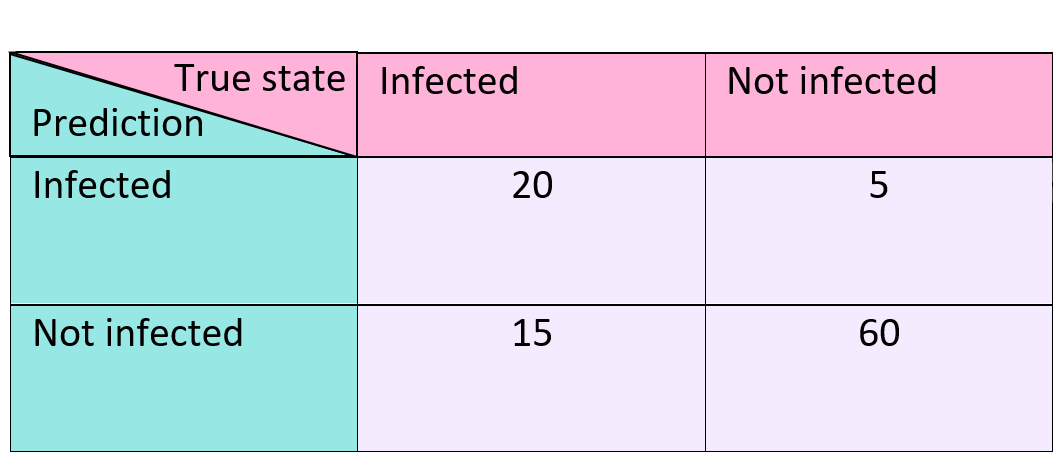
To really see what’s going on here let’s look at a specific example. We trial a test on 100 people and get the following results:
- 20 true positives
- 5 false positives
- 60 true negatives
- 15 false negatives
This means that, out of 100 people, 20 of them are correctly told that they have the disease; 5 people are told they have the disease when really they don’t; 60 people correctly receive a negative result; and a further 15 people get a negative result when they do in fact have the disease.
Putting these numbers into our confusion matrix we have the following:
Looking at the matrix alone doesn’t really give much away or tell us anything we didn’t already know, so we mainly use them to display results. However, we can use the values from the confusion matrix to calculate different measures for how useful a test is. Some of the most commonly used measures are: accuracy, error rate, sensitivity and specificity.
Accuracy is the proportion of results that are correct. In order to calculate it, you divide the number of correct predictions (TP+TN) by the total number of predictions (TP+TN+FP+FN), so accuracy = (TP+TN) / (TP+TN+FP+FN). In our example where we have tested 100 people, the accuracy is (20+60) / (20+60+5+15) = 80/100 = 4/5. This means that 4 out of 5 predictions made by our test were correct.
The error rate is the proportion of our results that are incorrect. It can be calculated using the formula: error rate = (FP+FN) / (TP+TN+FP+FN). For our example, error rate = (5+15) / (20+60+5+15) = 20/100 = 1/5. Therefore 1 out of 5 predictions by our test were incorrect. This hopefully isn’t too surprising – if you compare this to the accuracy, you can see that error rate = 1 – accuracy.
You may well have heard of the terms accuracy and error before, and maybe you’ve noticed them being mentioned in the news too. However, when we’re looking at false positives and false negatives, we often want to focus on sensitivity and specificity to evaluate our tests instead.
Sensitivity is the true positive rate. But, what does this actually mean? Well, it’s the proportion of those who have the disease that get a positive result. We calculate it using the formula TP / (TP+FN). For our example, the sensitivity would be 20 / (20+15) = 20/35 = 4/7. In other words, 4 out of 7 people with the disease were correctly identified as being infected.
The specificity, with formula TN / (TN+FP), tells us the true negative rate – the proportion of people that don’t have the disease and are correctly given a negative result. For our example: specificity = 60 / (60+5) = 60/65 = 12/13. That is, 12 out of 13 of those without the disease were given a correct result.
Be careful – sensitivity and specificity aren’t linked in the same way that accuracy and error rate are! A quick check tells us that sensitivity is not 1 – specificity.
A good way to remember the difference between sensitivity and specificity is to think about a car alarm. If it was very sensitive, then the alarm would go off too easily, say reacting if the wind blew too hard, and you would get a lot of false alarms – it would go off all the time. If the alarm was too specific, then it would only react when someone broke in a very certain way and may not go off if the car did get broken into. We can see that we want to find a balance between sensitivity and specificity and this where something called an ROC curve comes into play… but more about this in the next article.

[…] saw last time how to truly evaluate the performance of a test for a disease, using several different parameters […]
LikeLike