
Ruby Nixson
Back in 1881, astronomer Simon Newcomb was having a quiet day at work, letting his mind wander. Looking at his book of logarithm tables, he noticed that the first few pages were far more worn and dirty than the final pages. In fact, all of the log table books that he shared with colleagues were more worn at the start than at the end. What could this mean? Why did his fellow scientists need logarithms with first digit 1 and 2 more often than they needed those starting with 8 or 9? It seemed a mystery for the ages…
Fifty seven years later, the same observation was made by physicist Frank Benford. He tested 20 different sets of data – including the value of the populations of over 3000 US cities and over 100 physical constants – and found that all of them demonstrated the law which now bears his name: in many naturally-occurring sets of data, the leading digit of each number is more likely to be small (e.g. 1 or 2) than large (e.g. 8 or 9). More precisely, a set of numbers satisfies Benford’s law if: Probability that d is the leading digit = log(1 + 1/d) when d is any whole number from 1-9. This is what is known as a ‘logarithmic relationship’ and so it makes complete sense that Newcomb noticed this in his log tables!
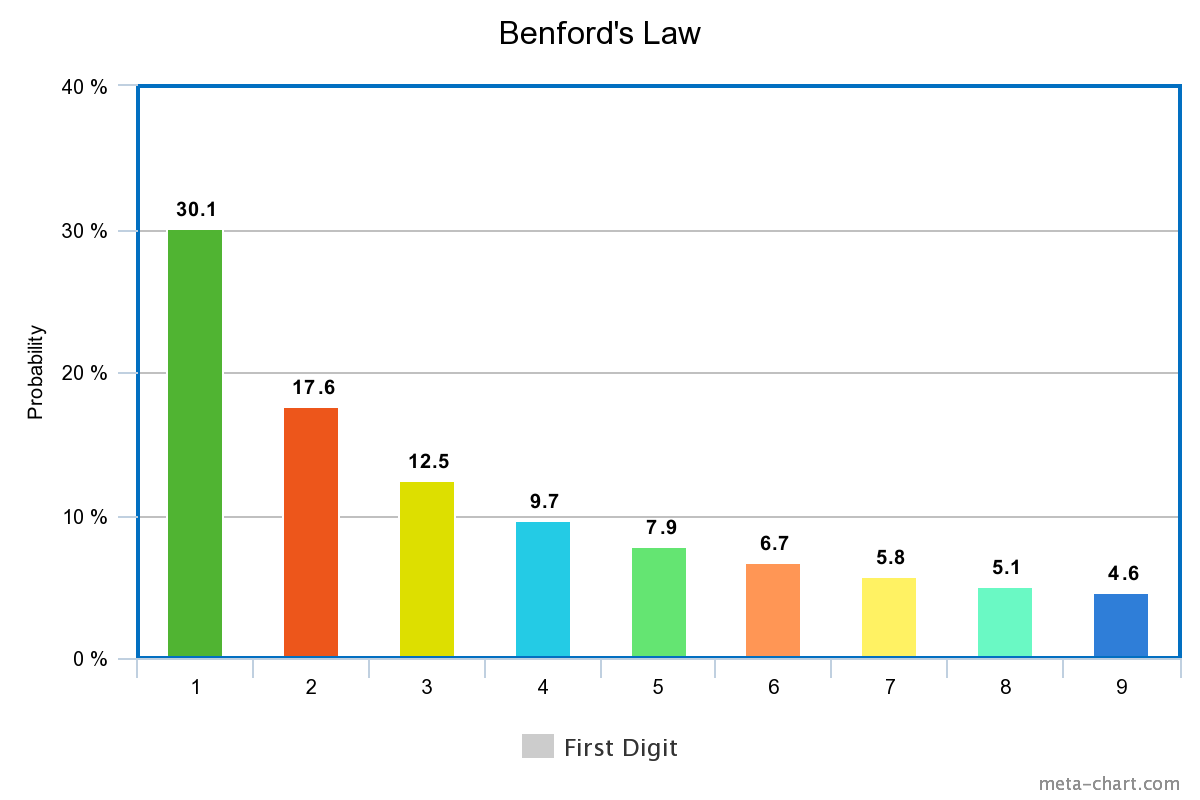
So, what does this actually mean for numbers? And why is it so surprising? Well, if the distribution of the first digit was uniform – meaning each number was equally likely – then each whole number from 1 to 9 would be the first digit approximately 11% of the time (since 1/9 = 0.11). But for data satisfying Benford’s law, 1 appears as the first digit almost one third of the time and almost twice as often as 2. The larger numbers appear less and less often, but become closer in probability. So for example, 8 is only 0.5% more likely to be the first digit than 9.
Despite being around for over 100 years, attempts to fully explain this phenomenon have only made progress fairly recently. In the 1990s, mathematician Ted Hill provided the best explanation to date, which can be found in full detail here. In short, Hill’s explanation connected the properties of base-invariance and scale-invariance for data which obeys Benford’s law, with the idea of the data coming from multiple distributions.
So now we know what Benford’s law is, we can start to ask what type of data do we expect it to work for? It turns out that data will obey Benford’s law more accurately when it spans multiple orders of magnitude, for example, data taking values between 100 and 100,000. So data such as the population per square mile in a given country is quite likely to obey Benford’s law, as is the number of followers a person has on Twitter or Instagram. Professor Jennifer Golbeck looked at just that in a 2015 paper and the results show that Benford’s law does in fact hold true for most social media platforms. Perhaps even more suprisingly (or not if you’ve bought into the law), a quick count shows that 30% of the 100 most followed Twitter accounts have 1 as the first digit of the number of tweets on the account. Generalisations of the law have also been found for the second, third, and higher digits, as well as numbers in bases other than base 10.
However, not all data will follow Benford’s Law. For example, the height of adult humans won’t work as nearly all of the data will lie between 1m and 2m (so only has leading digit 1). Below is a graph representing the heights of adult females in inches. We can see that nearly all of the data lies between 55 and 75 inches, and so doesn’t obey Benford’s law. Instead, the data follow a ‘normal distribution’ which we’ll talk a lot more about in a later article (coming soon).
Some of the most natural sets of data obey Benford’s law extremely well. Take, for example, the powers of 2, which are generated by multiplying the previous number by 2, giving the sequence 1,2,4,8,16,32,… Considering the first 100 powers of 2 gives the following data:
| First Digit | No. of times it appears | Percentage |
| 1 | 30 | 30% |
| 2 | 17 | 17% |
| 3 | 13 | 13% |
| 4 | 10 | 10% |
| 5 | 7 | 7% |
| 6 | 7 | 7% |
| 7 | 6 | 6% |
| 8 | 5 | 5% |
| 9 | 5 | 5% |
As you can see that this fits Benford’s law pretty well, and taking many more powers in the sequence actually increases this accuracy. Other sequences, such as the Fibonacci numbers, the factorials, and the powers of nearly any whole number will in fact satisfy Benford’s law.
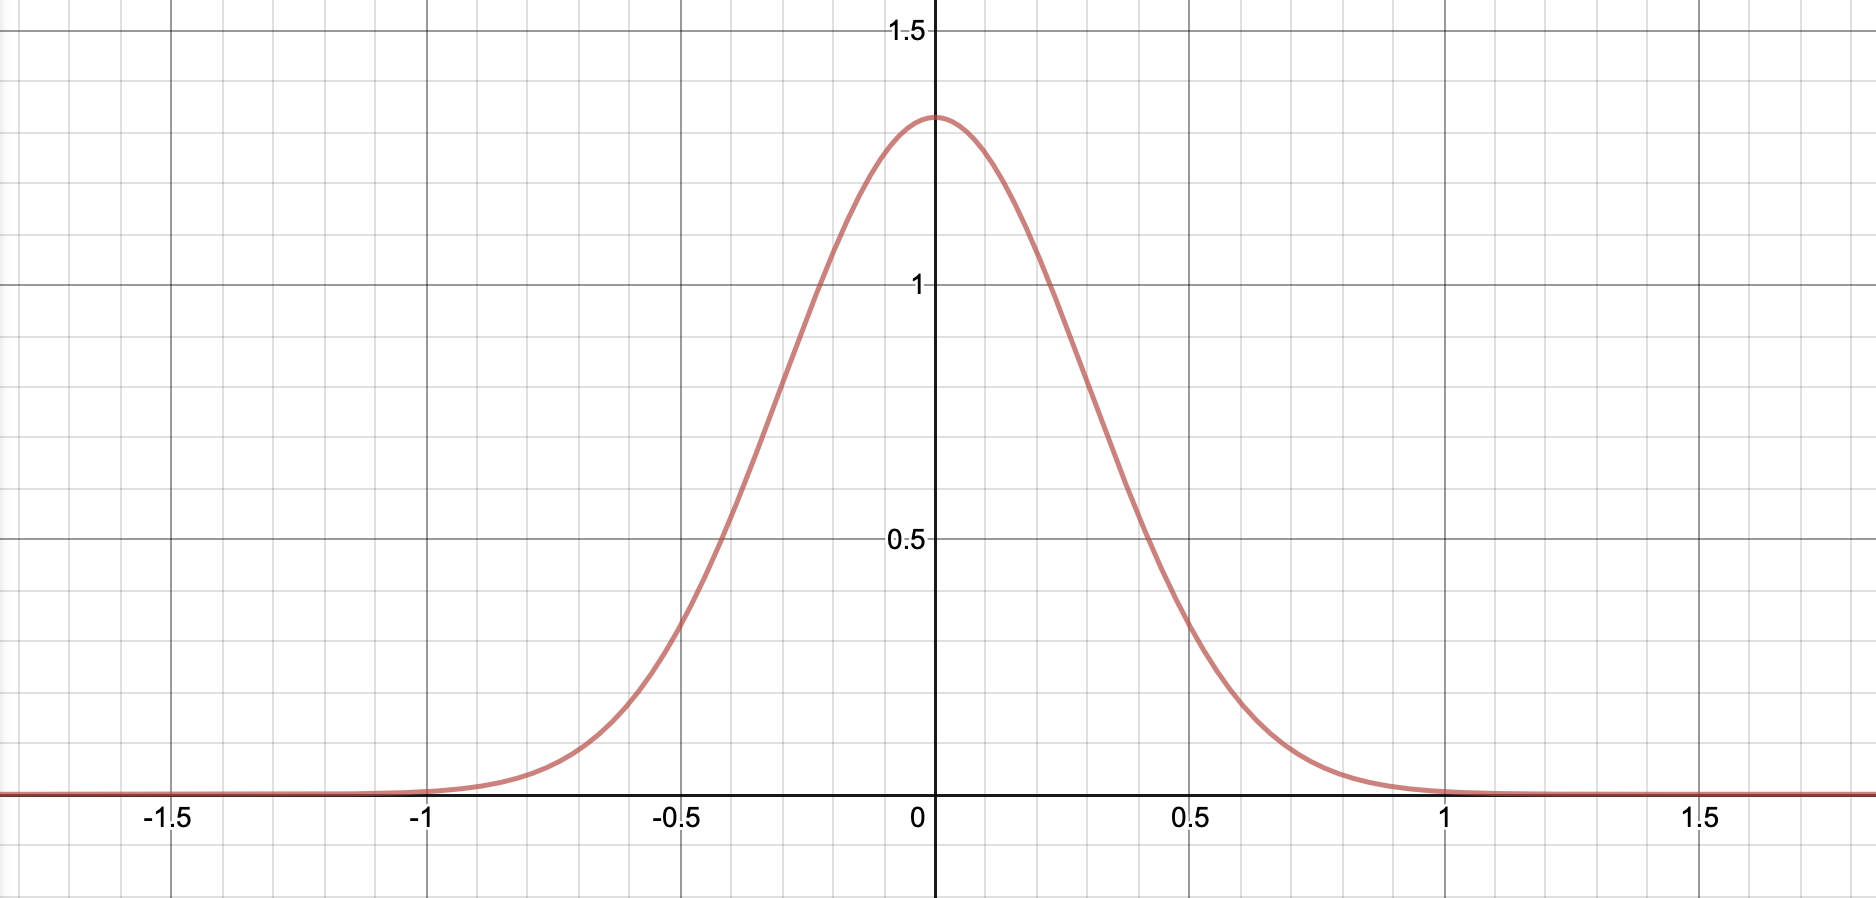
Now it’s probably around the point of the article where you’re starting to think along the lines of “Benford’s law might seem like a nice little observation about maths, but how can it help us in real-life?” Well, when people come up with fake data, they tend to pick data that is uniformly distributed, meaning each digit is equally likely to occur, or, if they are trying to be a bit smarter about it, perhaps normally distributed where the data is centred around a mean or average value. Below is an example of a normal distribution with mean 0 (notice the similarity in shape to the height data above):
However, a lot of financial data should in fact satisfy Benford’s law, so analysis of the first few digits of such data can help to detect fraudulent data sets in forensic accounting. This is seen in the Ben Affleck movie, ‘The Accountant’, and the Netflix series, ‘Ozark’, where the over-representation of certain digits is used to find fraudulent data. Very rarely, the fact that certain data should obey Benford’s law has even been used as evidence during criminal cases in the US, and some suggest that it proves electoral fraud in various elections worldwide, although many experts remain divided on whether or not Benford’s law should be used in this way. Most agree that Benford’s law can suggest that data is fake, but is not an automatic proof of guilt – in some cases there will be explanations as to why the data doesn’t behave as expected. However, in a time where streams of ‘fake news’ are being produced daily, who knows where Benford’s law might take us in the future?
