
Sian Langham
Why do we study Maths? A question I’m sure most of us have asked ourselves at some point – maybe it was when studying long division in school or when trying to help your child with their maths homework for the umpteenth time… What’s the purpose of it all? Well, let’s start simple. We need to use arithmetic when adding up the cost of our groceries in a supermarket, or percentages when working out the sale price of a discounted shirt. Delving a little deeper you will in fact discover that maths can be found in the most unexpected places, and in this series of articles I plan to explore some of these in detail to give you the perfect answer next time someone asks “why do we study maths?”.
Article 1: Binary Code and Storing Music on Computers
Article 2: Golf and Projectile Motion
Another powerful maths concept is Benford’s law and in particular, its uses in detecting fraud…
Benford’s law, also known as the law of first digits, is the observation that the first digits of the numbers in a set of data do not follow a uniform pattern (where each number is equally likely to occur) as many would expect, but an exponentially decreasing relationship (where the probability decreases rapidly at first but at an increasingly slower rate). The two relationships are compared below.

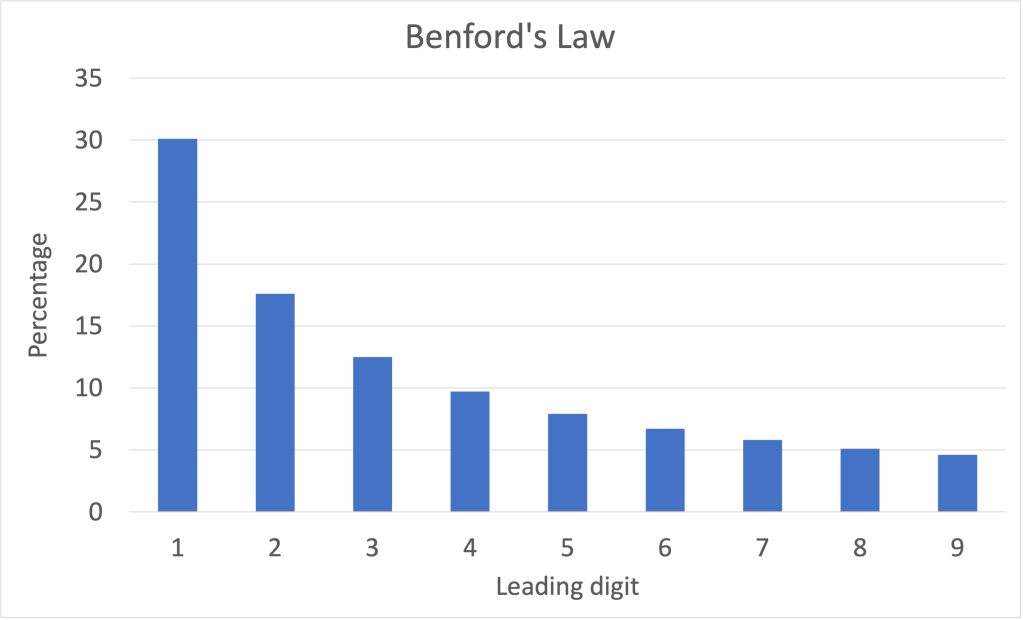
The specific exponential relationship seen in Benford’s Law says that if you take a random number from a set of data, the probability its first digit is one is about 30 percent and the probability of it being a two is around 18 percent. The probabilities continue to decrease in an exponential fashion until the probability of it being a 9 is just under 5 percent. This was first noticed by Simon Newcomb in 1881 while he was flicking through a book on logarithms and he noticed that the pages at the beginning of the book were more worn-out than those at the end. However, it wasn’t until 1938 that it became known as Benford’s law, when Frank Benford went through masses of data – from birth rates to physical constants – and found that they all roughly followed this exponentially decaying distribution. While at the time it was a very interesting observation, it had no real use until years later…
In recent decades Mark Nigrini has suggested that Benford’s law can be used in fraud detection, simply by plotting a graph of leading digits for a set of data and comparing it to Benford’s distribution. If the two graphs look noticeably different, then it could be a sign that the data has been manipulated. Lets look at the figure below as an example.
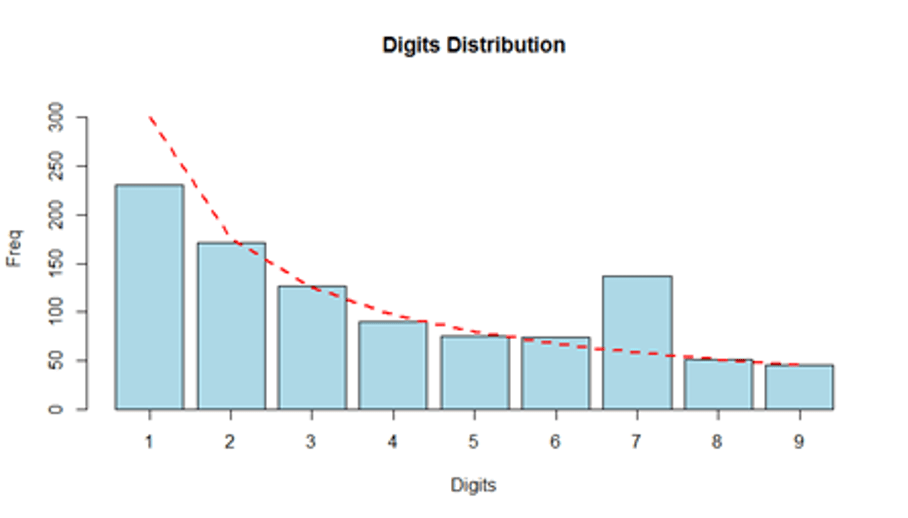
The blue bars show the distribution of leading digits for a set of data and the red dashed curve shows the expected pattern of the data based on Benford’s law. You can see from inspection that there are less data points beginning with one than we might expect and conversely more data points beginning with seven. As Benford’s law can only indicate where fraud might be present and therefore is not valid proof the data has been manipulated, checks will still need to be done on the results beginning with one and seven to confirm or deny fraud. For large data sets this could still be a tedious task and so we need some more help. Fortunately, we can do a second digit test on the data points with a leading digit of one or seven to narrow down which specific data points need to be checked for fraud.
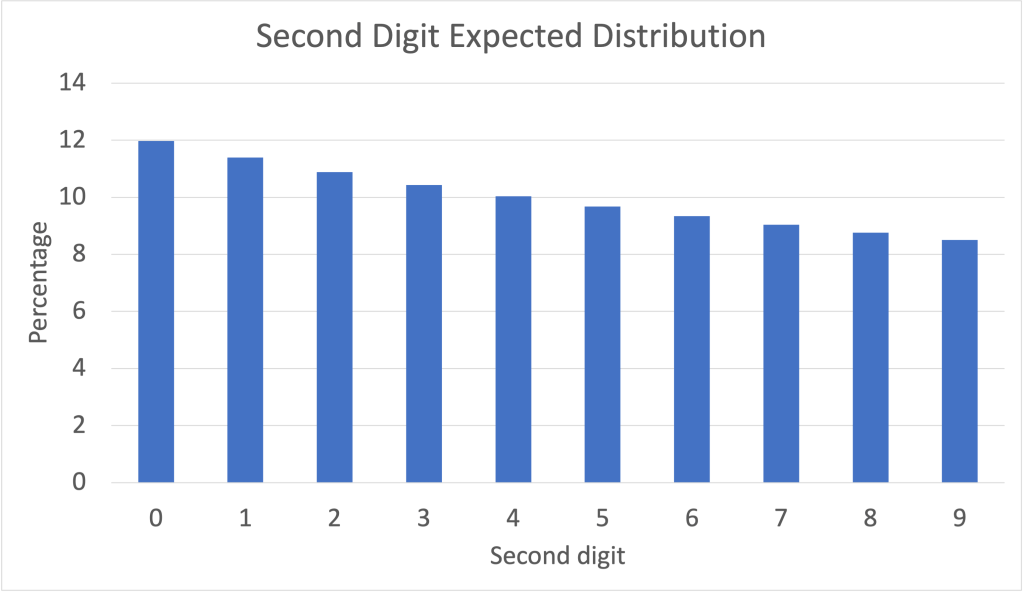
The second digit test graph looks different to the first digit version as it is less skewed and looks more similar to a uniform distribution. However, if there is deviation around the 3 and 6 being the second digit for example when one is the first digit, then just the data points beginning with 13 and 16 can be checked for fraud. So, whilst Benford’s law is not solid proof of fraudulent behaviour, it can make life a lot easier for investigators.
Now we know how it all works, let’s look at a real life application. A loan company has to refer any loan above 50,000 pounds to a loan committee for approval due to the large sums of money involved. The additional administration could be seen as inconvenient for the company and so the employees may try to manipulate the data and decrease the loan to slightly below 50,000 pounds so that it does not have to be approved by the committee. Therefore, a Benford’s law test can be carried out specifically looking at the leading digit of 4 (to see if it is higher than expected) and 5 (to see if it is lower than expected) to try to locate potential fraud. If there are anomalies in the first digit test, they can then conduct a second digit test to look at leading digits of 49 and 48 as this would seem to indicate manipulation of loan data to avoid being approved by the committee. The table below shows a possible set of data:
| Leading digit | 1 | 2 | 3 | 4 | 5 | 6 | 7 | 8 | 9 |
| Proportion | 28.3 | 16.8 | 12.0 | 15.0 | 5.40 | 6.5 | 5.6 | 5.7 | 4.7 |
| Benford’s Law | 30.1 | 17.6 | 12.5 | 9.7 | 7.9 | 6.7 | 5.8 | 5.1 | 4.6 |
| Deviation | -1.8 | -0.8 | -0.5 | +5.3 | -2.5 | -0.2 | -0.2 | +0.6 | +0.1 |
This table would seem to suggest just from inspection that a higher proportion of the data has a leading digit of 4 and a lower proportion has a leading digit 5. This is indicative that the data beginning with 5 may have been changed to appear just below the cut off point and so further investigations can now commence into the occurrence of these anomalies.
Benford’s Law was also used in 2009 to check Iranian voting results. There were four main candidates in the election, lets call them A, B, C and D. Candidate A won with 23 million votes and Candidate B finished second with 13 million votes. When voting figures for 366 areas of Iran were released, data analysts across the world noticed several anomalies. For example, candidate C had a higher proportion of voter numbers beginning with seven than Benford’s law would suggest. In the four areas that this occurred, Candidate A had a higher proportion of votes. Also, candidate A had less votes beginning with one and more votes beginning with two and three than would be expected. Taken together, this could indicate that someone had manipulated the data and changed figures beginning with one so they began instead with two or three. However, nothing can be proven until further investigations are carried out and in this instance the ballot papers remained hidden. It is important to remember that Benford’s Law is just a guideline and it is for this reason that some experts say it cannot be used as an indication of fraudulent behaviour in elections.
So far we’ve seen that Benford’s Law seems to work well for financial transactions, but not necessarily for elections, so why is this the case? Well, there are a few requirements that the data must follow in order for it to accurately obey Benford’s law. First, you must have a sufficiently large sample size. The true pattern of any set of data points will not be present with just a small amount of results. Second, there must be a large span of numbers so that every number is represented. Preferably you want the data to span a couple of powers of ten so that you can get more accurate results. You also cannot apply Benford’s law to human assigned numbers such as phone numbers and bank accounts. These requirements do limit the uses of Benford’s law in everyday life, as for example, an accountant wouldn’t be able to spot anomalies in a set of 20 cheques from a client because the sample size isn’t large enough, or if a client is only writing a fraudulent cheque once in every 500, then there would be no real noticeable difference in the distribution and it would go unnoticed. But, nevertheless, it is a very powerful tool for larger datasets and for this reason is used by financial institutions around the world.
I’m sure Simon Newcomb would be amazed to hear how his simple observation of worn pages at the front of a textbook would lead mathematicians to develop such a powerful and sophisticated tool that is still being used over 140 years later…

[…] Article 3: Catching Fraudsters with Maths […]
LikeLike