
Ioana Bouros
If you paid careful attention during your primary school maths classes (and very well done if so), you may recognise the following game: Sam shakes Bill’s hand; Bill shakes Jordan’s and Olive’s while Sam shakes Olive’s and she shakes Jordan’s. What is the number of handshakes exchanged by the friends? One way to do it is to simply count (very carefully) based on the text; but this gets messier the bigger the problem becomes and you’ll soon find that you cannot keep count at all. Another, more efficient way to do solve the problem is to visualise what we read:

This can be made even easier to understand if we represent our problem as follows:

This is what we call a network, where we define each dot (or vertex) to be one of our friends and an edge to be the line that connects two friends that have shaken hands. We most often hear of networks in the context of social sciences (e.g. which people know each other in a company), But, really, networks are very much a mathematical concept and understanding some of their mathematical properties can lead to very informative conclusions.
Take what Milgram did. In 1967, the American sociologist Stanley Milgram conducted a series of experiments aimed at understanding how well-connected society is as a whole (or better said, how fast gossip can travel). The “gossip” he used was in fact a letter. He gave one each to a number of people from remote regions in the US and asked them to have it delivered to a certain person in Boston, with the amendment that the letter could only be passed onto a person they were on a first-name basis with. What Milgram observed after this little stunt was that the median of the values of the number of intermediaries required for the parcel to arrive at its destination was 6. In other words, on average the letter passed between 6 people before reaching its final destination.

This particular experiment is often used an example to support the idea that in a natural society the degrees of separation between individuals is 6, or as it’s better known: “any person is on average 6 handshakes away from the president”! This, of course, sounds completely wondrous and may make you think what a small world we live in. In fact, this property seems to apply to most social networks and actually bears the name “the small world effect” for this reason.
But what does it mean to have so few intermediaries between any two people and why does this happen? Before getting to the answer, we should first familiarise ourselves with some terminology.
Take this network for instance:
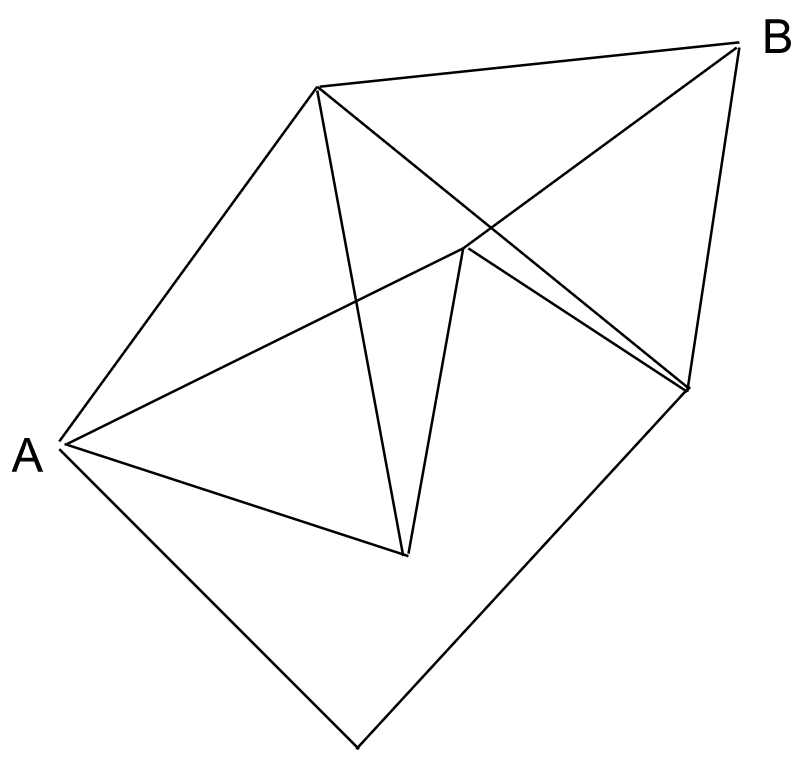
Considering two random vertices A and B, we look at trying to get from point A to point B by following the edges of the network. One possible way to do so could be as follows:
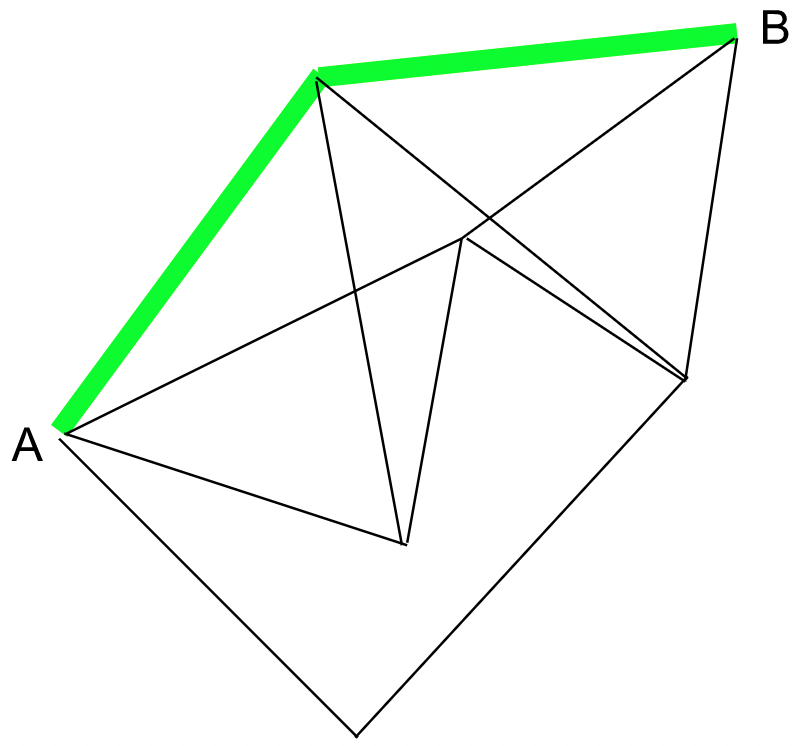
This is what we call a path. But that is not the only path we are able to take…
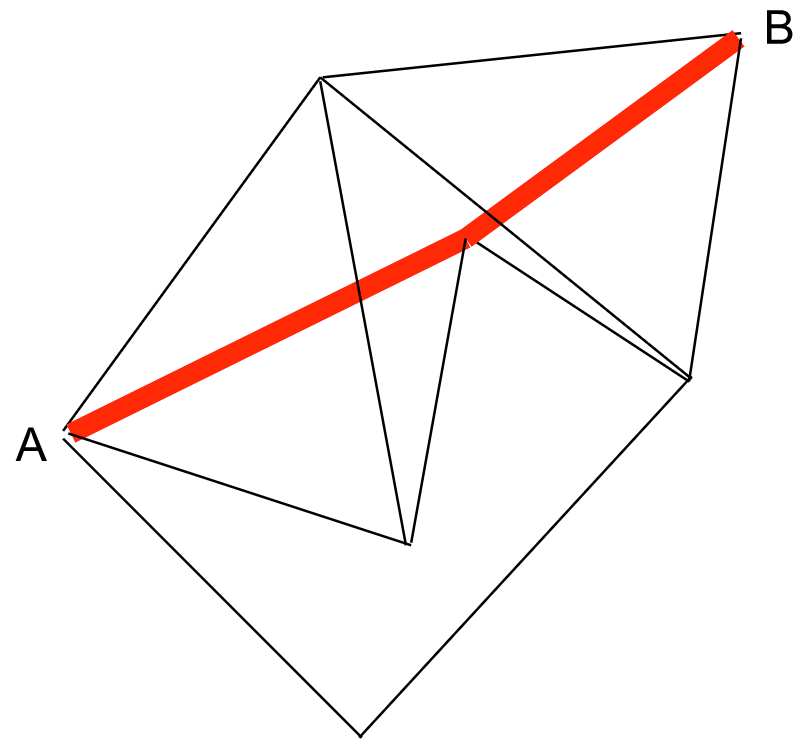
Here is a second path from A to B. Therefore, when faced with multiple paths between vertices, it makes sense to think of the shortest path between two vertices, which is, as the name suggests, the shortest route we can take to get from one vertex to the other.
In the context of Milgram’s experiment, that means that on average the length of the shortest path followed by the letter is 6 + 1, i.e. 7 (one higher than the 6 degrees of separation as the letter needs to pass between the vertices). As there are on average over 10 connections at each vertex and more than 1000 vertices in total, a path length of 7 is indeed ‘short’ in this context. The interesting thing is that the same happens in almost any network that you can construct, regardless of size, which is why the ‘small world effect’ is such a prevalent phenomenon.
To think of why such short lengths are in fact to be expected, we need only realise that some of the vertices of the network will form more connections than others and said connections will form connections between themselves, creating hotspots in the design, or what are referred to as “hubs”. This is equivalent to imagining the respective vertex as a very popular and influential individual in the society, who has a large group of friends (who are also likely to know each other) and so they make the passing of the letter to an individual closer acquainted to the one waiting at the destination much more likely.
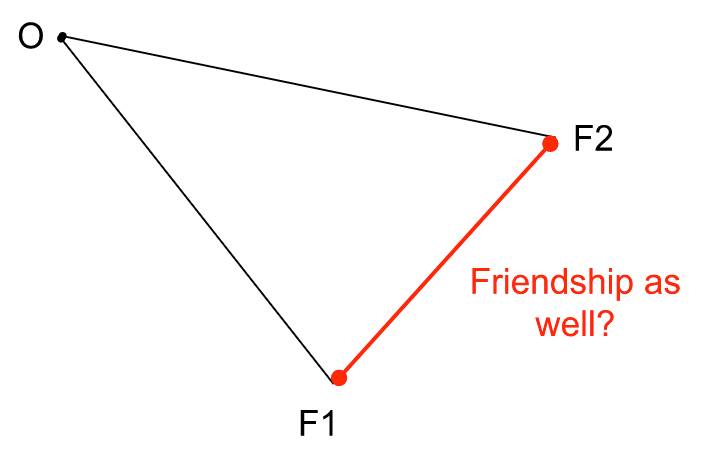
The proportion of “friends” of a vertex that are “friends” themselves (i.e. two vertices that connect to the original one that are themselves connected – like in the figure above), taken over all vertices in a network, is measured by what we call the global clustering coefficient. As humans are by nature sociable creatures, it is not unusual to assume that they are part of these smaller communities – our previously-mentioned hubs. So, we expect this global clustering coefficient to be high for a social network, which is in fact its second major defining property.
To recap, the small world effect on a network is synonymous with 1) ‘short’ path lengths and 2) high clustering coefficients. Therefore, any network with these properties is highly likely to exhibit the phenomena.
But, just observing a network is not really that useful or insightful; in fact, we would like to understand how it was formed, and whether there is an underlying pattern hidden somewhere between the many lines and pointy corners… This is why one often tries to give a model to represent a network.
The simplest commonly used model for a social network is that in which we assume an edge between two vertices appears independently from any other edge in the network, but always with the same probability. This model is known as the Bernoulli Random Graph Model.
However, upon careful examination, we discover that this is not always a good representation for some social networks.
For starters, let’s assume we can equate our social network to a Bernoulli Random Graph (BRG). The BRG is produced using suitable parameter values that give an expected shortest path length which is the same as the average shortest path length in the original network. And we say that the model is a good approximation of our original if and only if the summaries (specific measurements that characterise a network such as the global clustering coefficient or the average shortest path length that we have seen before) of both have the same order of magnitude. However, this will not always be the case.
For example, here are some of the values for the clustering coefficient C in a series of affiliation networks (individuals representing vertices, and edges the existence of a collaboration of the two individuals it connects):
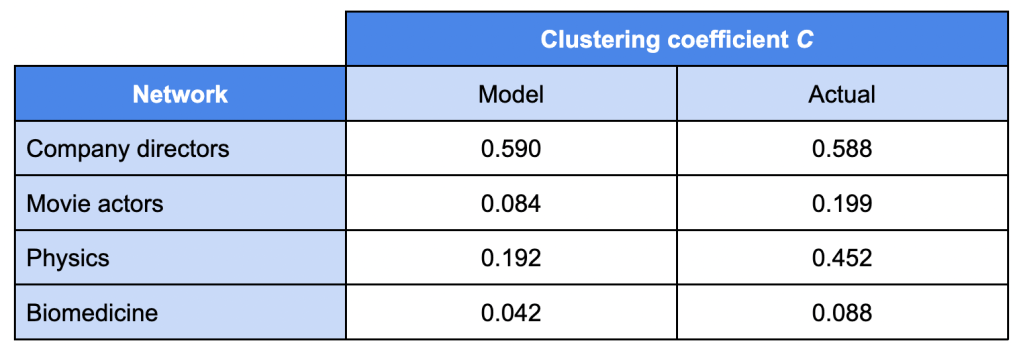
[Table taken from “Random graph models of social networks” by Newman, Watts and Strogatz (PNAS, Feb 2002, vol. 99, suppl. 1)]
In the analysed networks, except for Company Directors, we observe that the associated clustering coefficient of an equivalent Bernoulli Random Graph (the “Model” column) is more than two times smaller than the observed one in the social network (the “Actual” column). Which, indeed, means that the Bernoulli Random Graph is a poor substitute model for this particular social network.
In fact, trying other probabilistic models would lead to similar results, meaning that no universal model is particularly true or useful, and good modelling may in fact just be a matter of trial and error.
To finish this short introduction to the study of networks, I propose to you the following game:
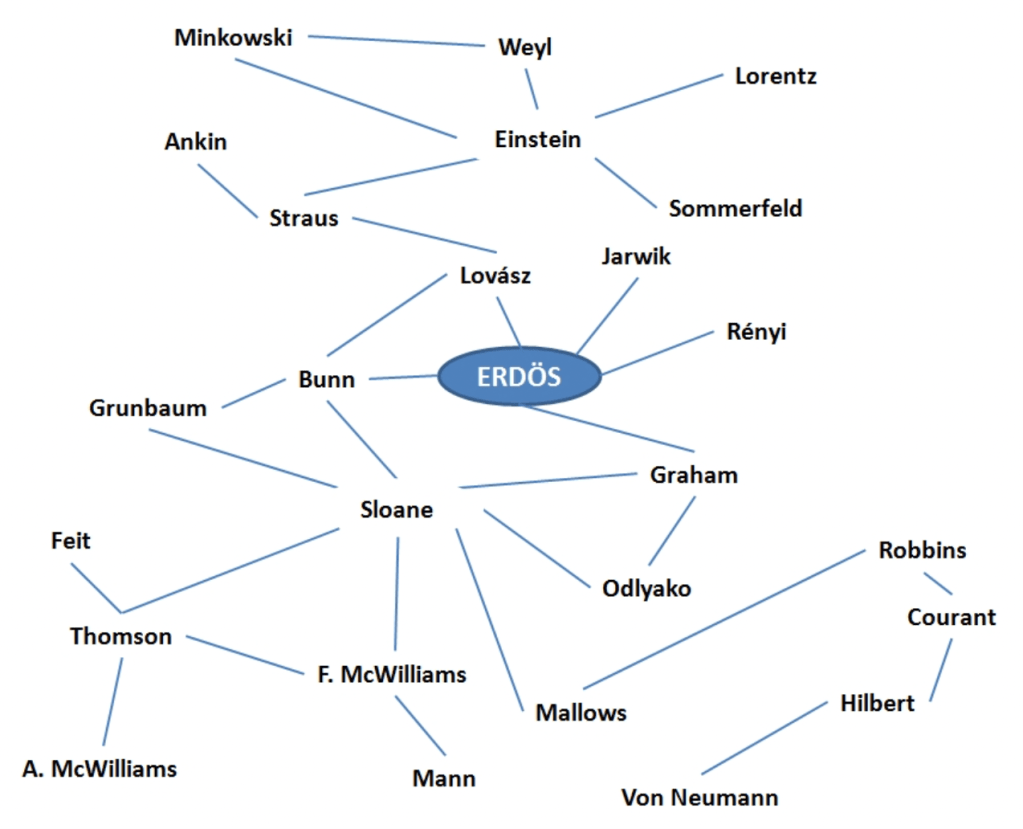
Paul Erdös (1913-1996) was a famous Hungarian mathematician considered to be one of the most prolific producers of mathematical conjectures of the last century. He authored many papers (over 1,500) during his lifetime, in collaboration with many co-authors which lead to the creation of the so-called Erdös number (EN). This number denotes the “collaboration distance” between Erdös and any other person in the collaboration network formed by underlying authorship connections between mathematicians.
If we consider direct collaborators to have EN 1 and so on, what are the Erdös numbers of the following people (including the links):
- Odlyako
- Thomson
- Minkowski
- Grunbaum
- Mallows
Scroll down for the solution!
.
.
.
.
.
.
.
.
.
.
.
.
Solution
- Odlyako – Graham – Erdos => 2
- Thomson – Sloane – Bunn (or Graham) – Erdos => 3
- Minkowski – Einstein – Straus – Lovasz – Erdos => 4
- Grunbaum – Bunn – Erdos => 2
- Mallows – Sloane – Bunn (or Graham) – Erdos => 3
